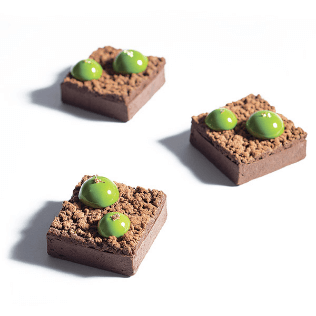
Produits de boulangerie, desserts et spécialités surgelées premium
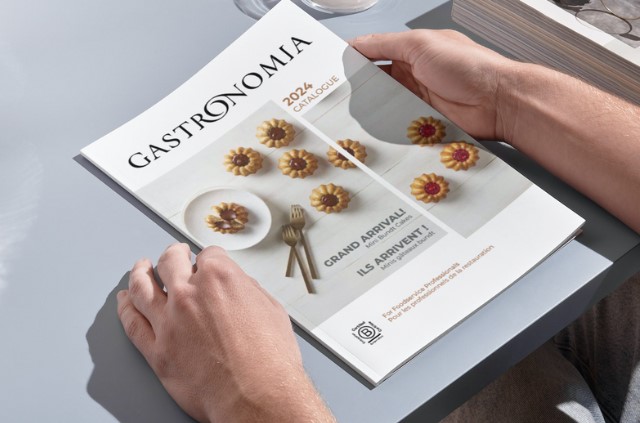
Téléchargez notre catalogue de produits 2024
Fier fournisseur des hôtels et restaurants de prestige au Canada depuis 1998, nous sélectionnons les meilleurs produits surgelés pour répondre aux tendances d’ici et d’ailleurs.
Fournisseur des professionnels de la restauration depuis 1998
Découvrez nos gammes de produits surgelés premium
Gastronomia, au service des chefs et des détaillants à travers le Canada
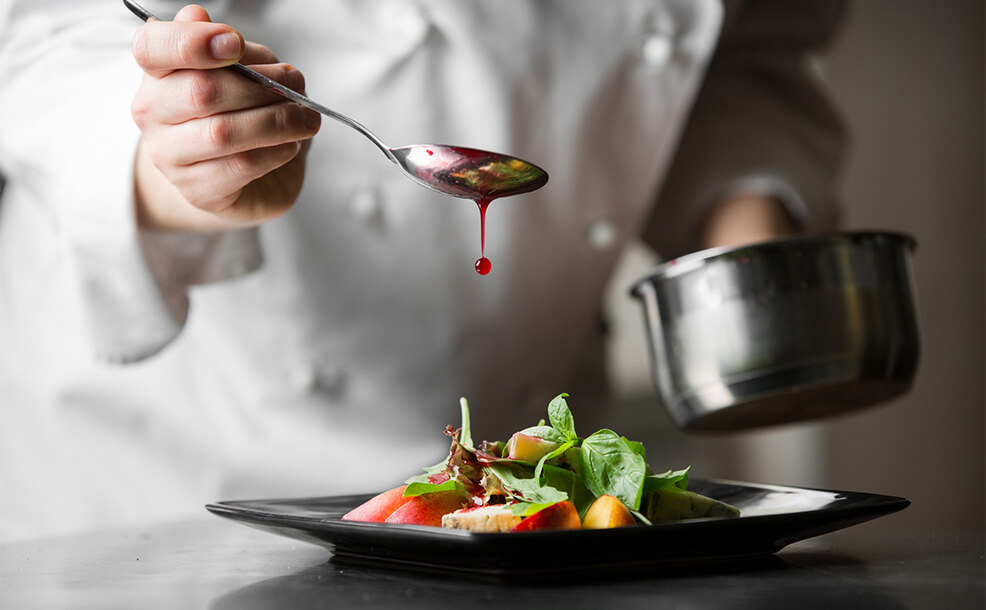
Complice des chefs du service alimentaire
Gagnez en temps et en efficacité grâce à nos produits surgelés premium de l’entrée au dessert, sans compromis sur le goût et la qualité.
- Hôtels
- Restaurants et cafés
- Traiteurs et banquets
- Casinos et clubs de golf
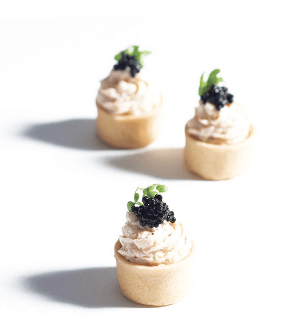
Allié de confiance du commerce de détail
Étoffez votre offre avec nos produits de boulangerie en marque blanche, et nos mets cuisinés surgelés Cool&Simple, notre marque pour les particuliers.
- Chaînes d’épiceries
- Épiceries indépendantes
- Espace surgelé à la marque Cool&Simple
Complice des chefs du service alimentaire
Gagnez en temps et en efficacité grâce à nos produits surgelés premium de l’entrée au dessert, sans compromis sur le goût et la qualité.
- Hôtels
- Restaurants et cafés
- Traiteurs et banquets
- Casinos et clubs de golf
Allié de confiance du commerce de détail
Étoffez votre offre avec nos produits de boulangerie en marque blanche, et nos mets cuisinés surgelés Cool&Simple, notre marque pour les particuliers.
- Chaînes d’épiceries
- Épiceries indépendantes
- Espace surgelé à la marque
Cool&Simple
Spécialiste en produits de boulangerie et desserts surgelés
Vous êtes intéressé par nos produits surgelés premium?
Quand gourmandise, raffinement et innovation se conjuguent
Qualité premium
Innovation constante
Sécurité alimentaire
Nous sommes leurs complices en cuisine
Nous attendons l’accord des établissements. Combler le vide avec n’importe quoi pour le moment, nous ferons le changement. merci!
Ce qu’ils ont à dire sur Gastronomia
De par la qualité et la sélection des produits proposés par Gastronomia, le service à la clientèle est un des meilleurs sur la province du Québec. Une source de référence en terme de qualité!
J’utilise les purées de fruits Gastronomia parce que ça minimise mes pertes. C’est aussi plus constant, plus fiable que si je faisais mes propres purées. Les fruits sont surgelés sur le champ et non dans un bateau.
J’utilise les viennoiseries Gastronomia depuis plusieurs années et je n’ai que de bons commentaires à faire sur ces produits. J’utilise aussi les champignons surgelés qui sont très pratiques et de bonne qualité.
J’utilise les viennoiseries Gastronomia depuis plusieurs années et je n’ai que de bons commentaires à faire sur ces produits. J’utilise aussi les champignons surgelés qui sont très pratiques et de bonne qualité.